Introducing LINQPad.QueryPlanVisualizer
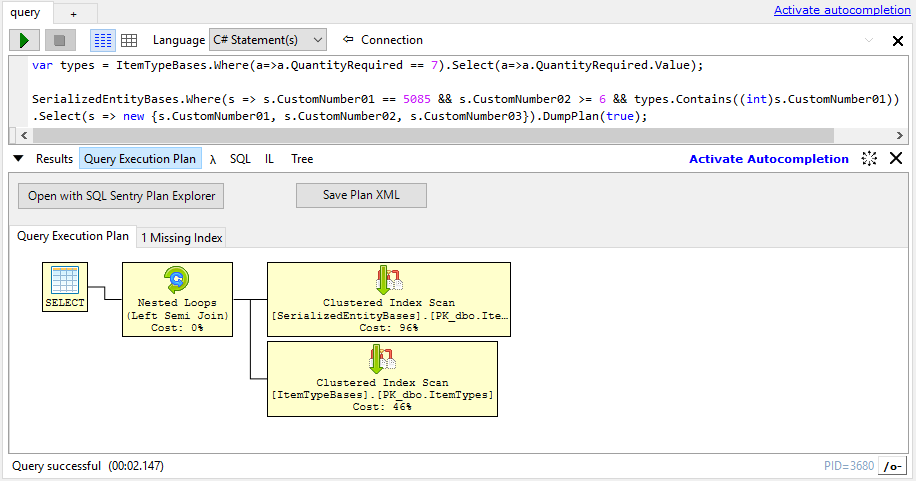
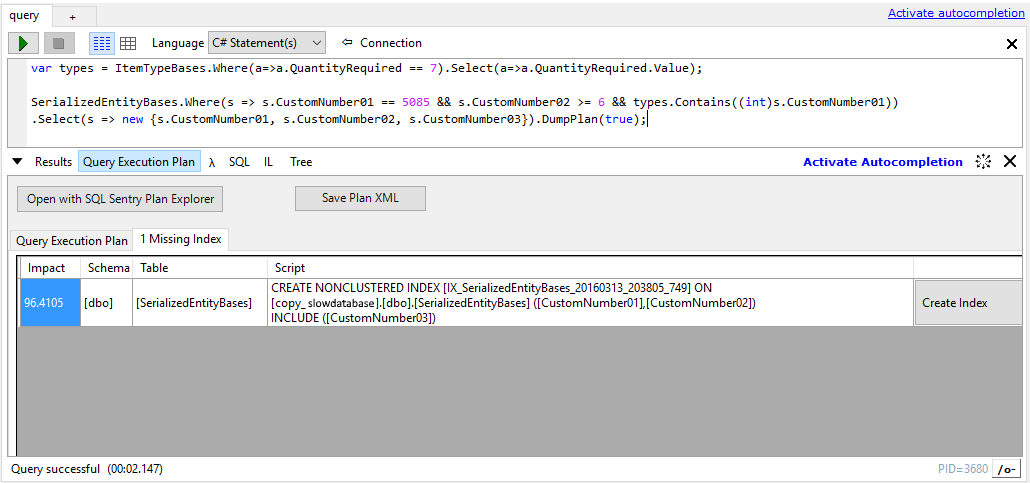
If you are a heavy LINQPad user you have probably wished to be able to see query execution plan details inside LINQPad. Currently the only way to view query execution plan is to switch to SQL tab, click Analyze SQL button and open the query in SQL Server Management Studio. I got tired of clicking all these buttons and decided to write custom visualizer which solves the issue. With LINQPad.QueryPlanVisualizer you can now view query execution plan and missing indexes as well as create those missing indexes without leaving LINQPad.
LINQPad.QueryPlanVisualizer
With LINQPad.QueryPlanVisualizer you can:
- View query execution plan
- View missing indexes for query
- Create missing indexes
- Open plan in SQL Server Management Studio or other default app
- Save plan to xml file


How it works
The visualizer executes SET STATISTICS XML ON command before executing the actual query to retrieve the actual execution plan from database. After that it converts the xml plan to html and uses
html-query-plan library to display the resulting html. Missing index details (if any) are extracted from the execution plan xml too.
For more details and installation guide visit the project at https://github.com/Giorgi/LINQPad.QueryPlanVisualizer